Youth & Adolescents
These data dashboards provide a thorough visual overview of adolescent substance use alongside key behavioral health indicators. Developed in response to the findings from the Capacity Building and Strategic Planning Project, a collaborative effort between The Office of Child and Family Services and OMNI, these dashboards offer valuable insight into understanding adolescent substance use trends in the Commonwealth. These dashboards contain data from across VASIS that pertain to the experiences of youth and adolescents under the age of 18 in Virginia.
Access to Care
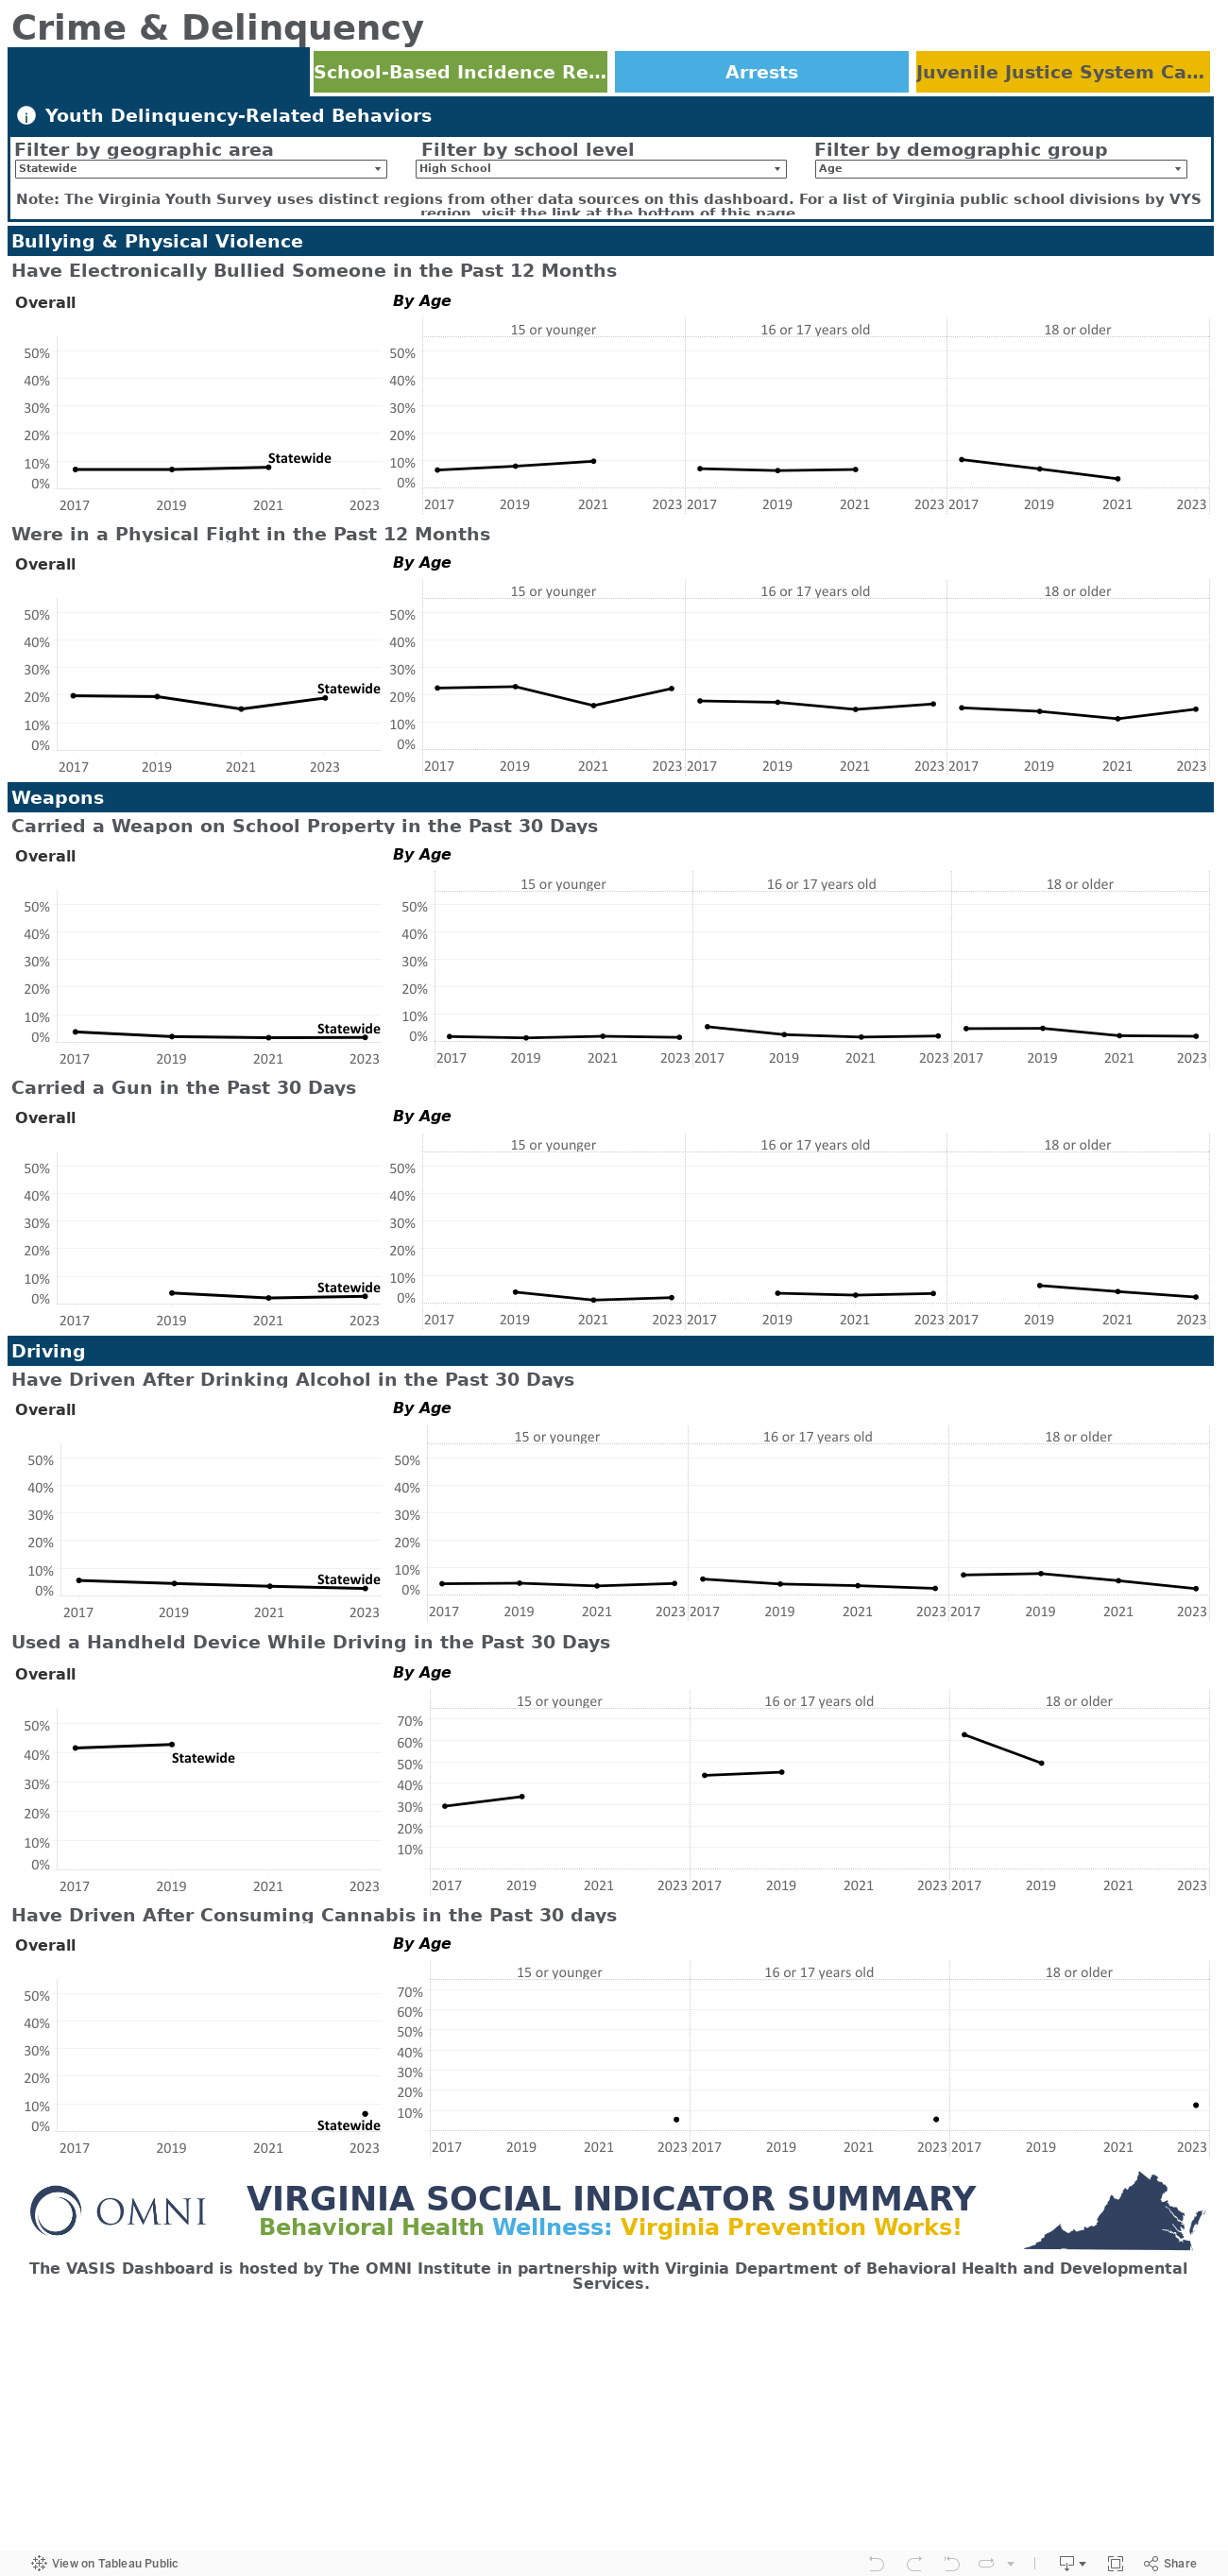
Crime & Delinquency
This dashboard compiles indicator data related to youth involvement in criminal behavior and the justice system in Virginia. Explore data on youth delinquency, school-based behavioral incidents, crime rates, arrest trends, and juvenile detention and probation. Understanding these trends can inform efforts to improve prevention strategies, promote alternatives to incarceration, and support interventions that help youth navigate challenges and reduce future criminal involvement. The data on this dashboard are provided by the Virginia Department of Juvenile Justice, the Virginia Department of Education, the Virginia Department of Health, and the Virginia Department of Criminal Justice Services.
Virginia Youth Survey Regions
The Virginia Youth Survey utilizes unique region structures from most data on VASIS. For information on Virginia Public School Divisions by region, click here.
Filtering Data
Hovering over a locality, CSB, or region on the map, or over a data point on a graph will highlight exact data values. Select a locality, CSB, or region on the map or table to filter the data to that location.
Don't want to see everything? Use filters to select data from demographic subgroups. Please note that additional filters are available and vary by tab.
Downloading Data
The download button at the bottom right of each dashboard allows you to download a PDF or image of the current dashboard view. At the top of each tab, you will also see an information icon. Hover over the icon to read more about the data sources and links to access the raw data, if available.
-
To generate the SBAR behavior infraction rates, OMNI gathered student population data from the Virginia Department of Education’s (DOE) Enrollment & Demographics datasets. The DOE collects information about how many students are in each grade(from Preschool to 12thgrade) every school year. The schools report these totals directly to the DOE, but not all schools provide student population information. Instead, the data is provided as a missing value. This means that the DOE’s data does not show the true number of students enrolled across Virginia. Because of this, the behavior rates presented in the dashboard are slightly skewed, though they still give a close estimate of behavior rates per 1,000 students at the locality, CSB, and region levels.